AI-Powered Planogram Intelligence
DS Stream optimizes retail shelf space and planograms using AI and analytics, turning every square meter of selling space into measurable margin. We combine sales velocity, customer flow, and category performance to recommend planograms that maximize revenue per linear foot.
AI-driven planogram and space optimization at SKU-store level
We deliver shelf and space recommendations grounded in sales velocity, customer flow analytics, and category performance at store-specific granularity.

Why Traditional Planograms Underperform Modern Retail
One-size-fits-all planograms ignore store-level demand variation, customer flow patterns, and SKU velocity differences. The result: low-performing facings, stockouts on best-sellers, and margin left on the shelf.
Shelf & Space Optimization Analytics Capabilities
Sales-per-facing analytics identifying underperforming and overperforming SKUs per store cluster.
AI-generated planograms balancing margin, velocity, and category strategy per store.
Heat-map and traffic analysis informing high-value placement decisions.
Revenue and margin per linear foot tracked at SKU, category, and store level.
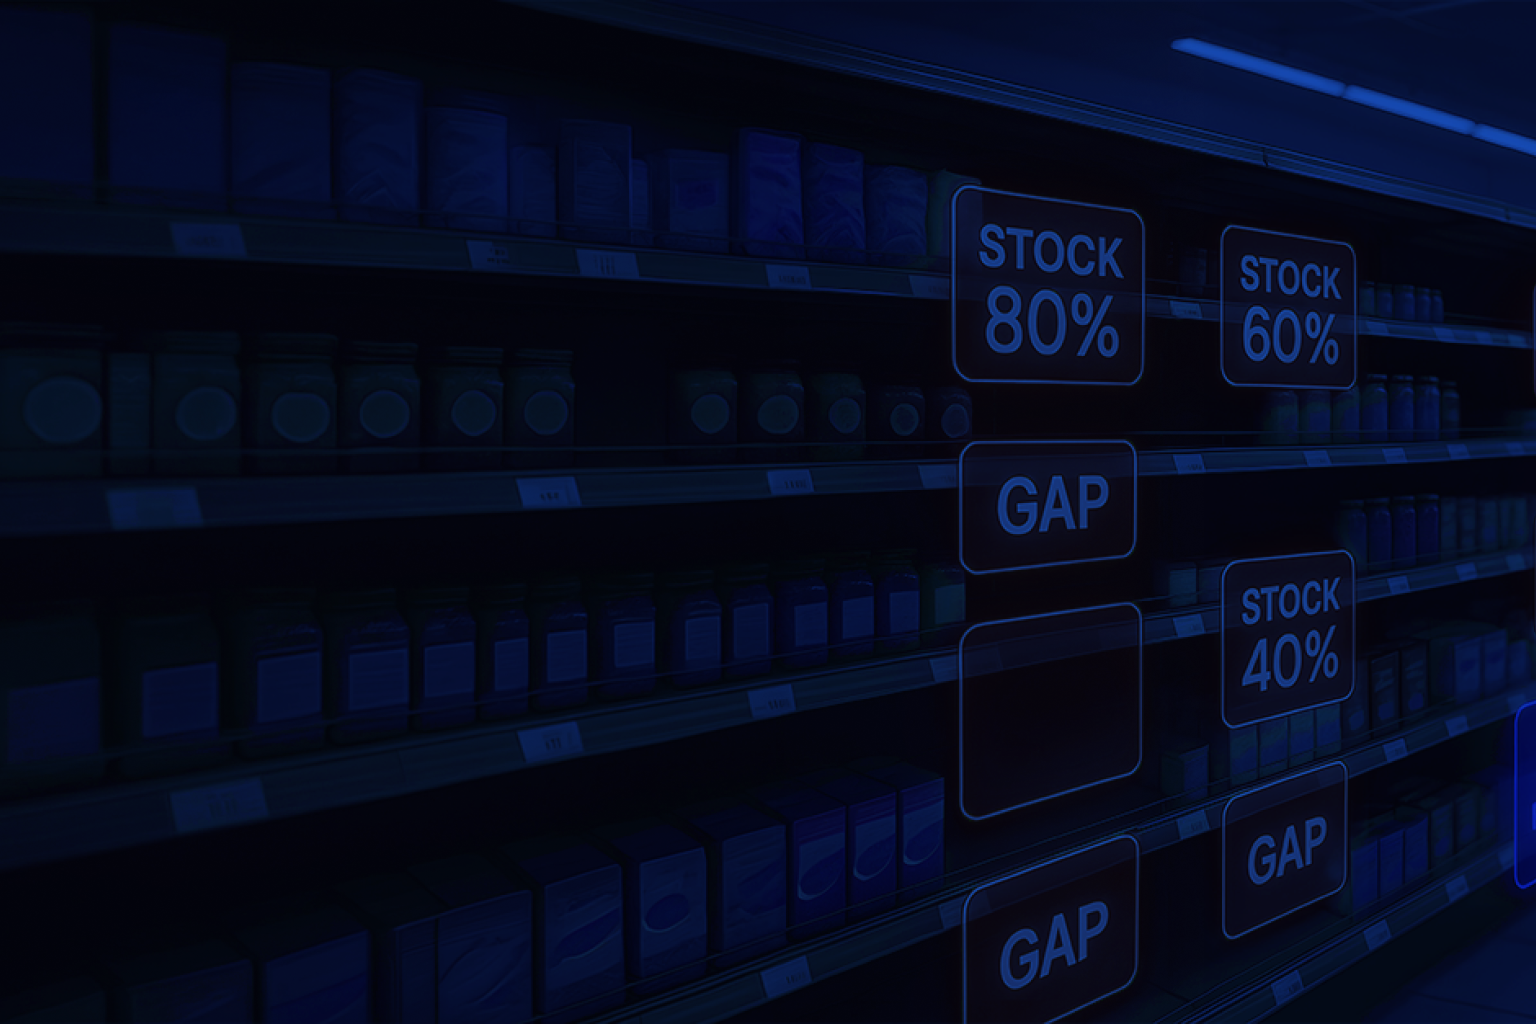
Shelf compliance audits via in-store imagery and AI-powered visual recognition.
How We Build Your Shelf & Space Optimization Analytics Practice
Space productivity baseline, opportunity sizing per category and store cluster, data assessment.
Build models for pilot category and store cluster, deliver planogram recommendations, measure lift.
Scale to all categories and stores with embedded recommendation tooling for category managers.
Business Impact
5–12% sales lift from optimized planograms at the store-cluster level.
Reduced stockouts through velocity-aware facing allocation for best-sellers.
Higher space productivity measured in revenue per linear foot per category.
Who This Is For
Use Cases for Shelf & Space Optimization Analytics
We deliver Shelf & Space Optimization Analytics engagements across retail verticals with deep category expertise.
Most Common Questions
SKU-level sales by store, planogram inventories, store master data, and ideally customer flow analytics from in-store sensors or cameras.
Pilot category measurable lift in 12 weeks. Full enterprise rollout typically 6–9 months across categories.
No — we provide AI recommendations; category managers retain decision authority and add strategic context.
We integrate with JDA, Blue Yonder, Relex, and similar tools — providing AI recommendations as inputs to existing workflows.
We optionally add computer vision audits to ensure planograms are executed as designed in stores.
Ready to Optimize Your Shelf Space with AI?
Book a free 30-minute review. We will size the opportunity in your business and outline a clear path to measurable space productivity gains.
Opportunity Diagnostic
3-week diagnostic to size space optimization opportunity across categories and stores.
Pilot Category
12-week pilot with planogram recommendations deployed and measured in pilot stores.
Enterprise Rollout
Scale to all categories and stores with embedded category manager tooling.